

The London Property Lens · Monthly Sales Edition
Executive Summary
London asking prices fell 1.6% in July to £676,248. The Bank of England held Bank Rate at 3.75% on 30 July, though three of nine Monetary Policy Committee members voted for a rise. Official completed-sale figures for May put the average London home at £545,000, 3.7% below a year earlier — the lowest annual change of the English regions on that release.
Greater London Overview
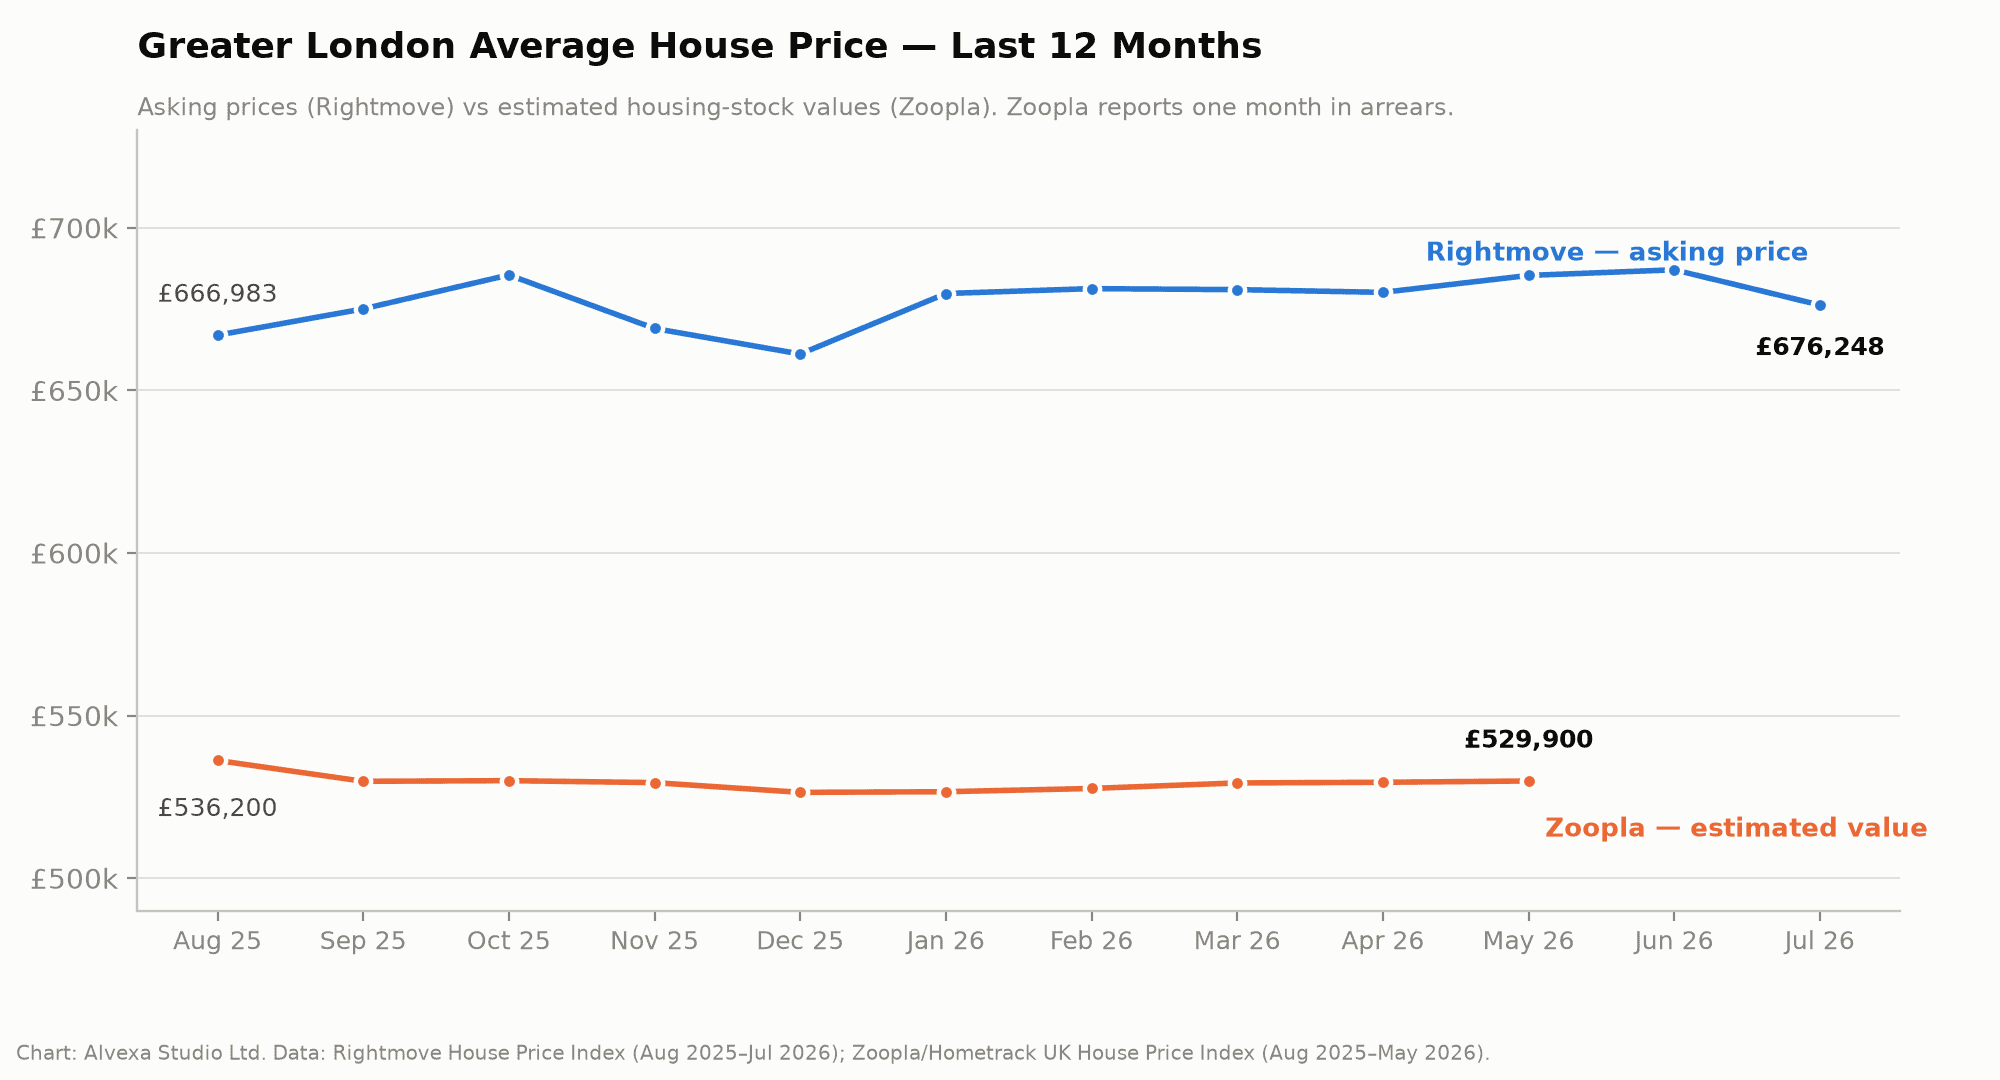
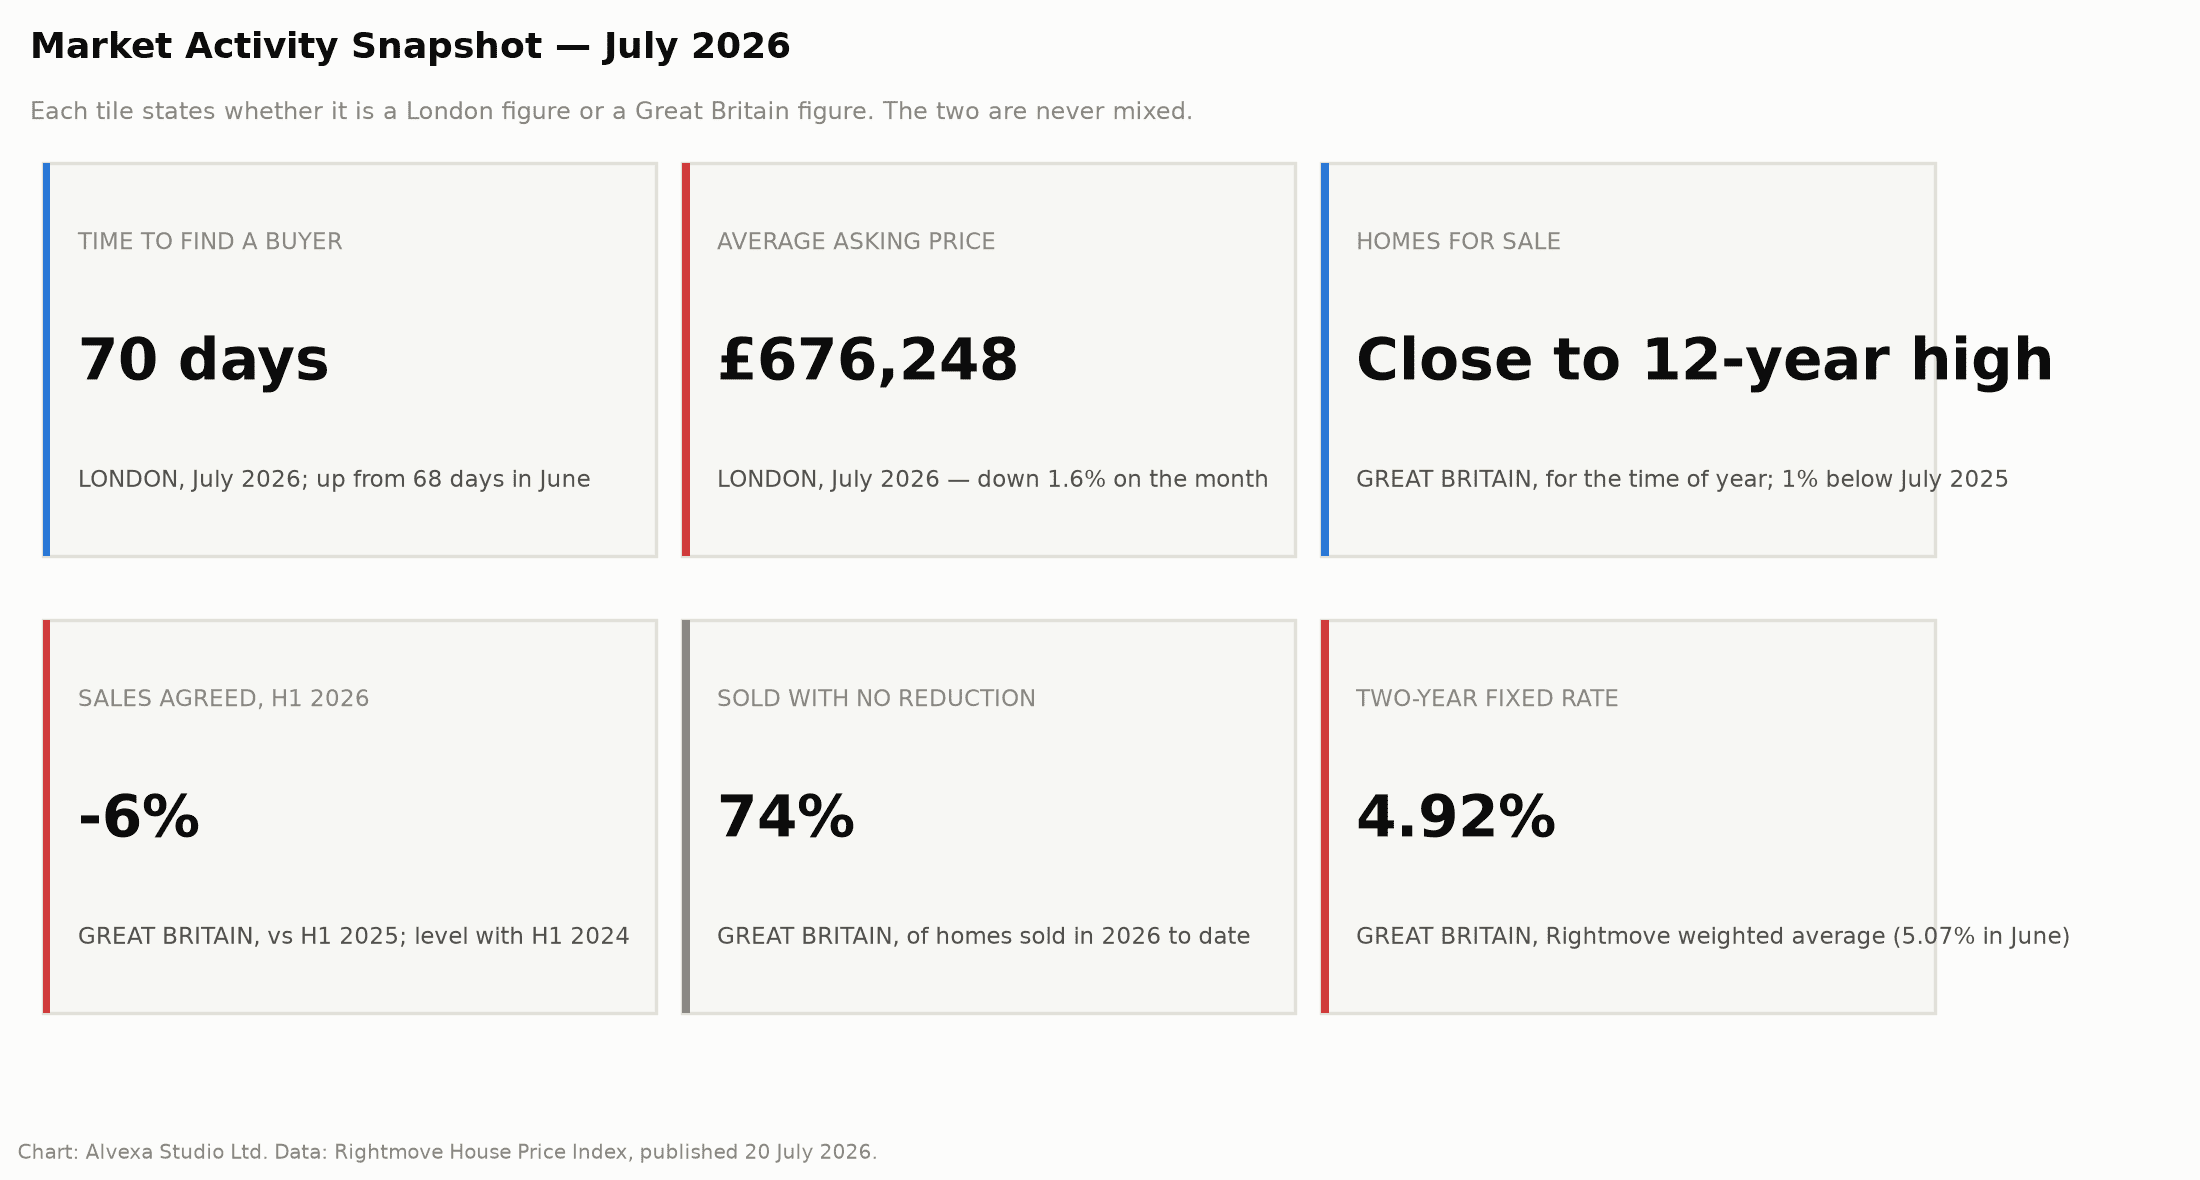
Rightmove’s index, published 20 July 2026, put the average asking price of a newly listed London home at £676,248, down 1.6% on June. Across Great Britain the average fell 1.0% to £372,359, 0.4% below a year earlier, against a typical July fall of 0.2% over the previous decade. Rightmove described the number of homes for sale across Great Britain as “slightly below last year (-1%) but still very close to 12-year high”. Its July regional-history table recorded 70 days as the average time for a London seller to find a buyer, up from 68 days in June.
Completed prices move more slowly because they are recorded after a sale rather than at listing. The ONS and HM Land Registry UK House Price Index, published 22 July 2026, put the average London home at £545,000 in May 2026 — 3.7% below May 2025 and 1.2% below April. Zoopla’s 30 July index reported UK annual growth of 1.3% to June and said its estimated value for a typical London home was £3,270 lower over the year to June 2026. Sales agreed were 9% below a year earlier on Zoopla’s UK measure and 6% lower in the first half of 2026 on Rightmove’s. These asking-price, estimated-value and completed-sale measures are reported separately.
Borough Spotlight
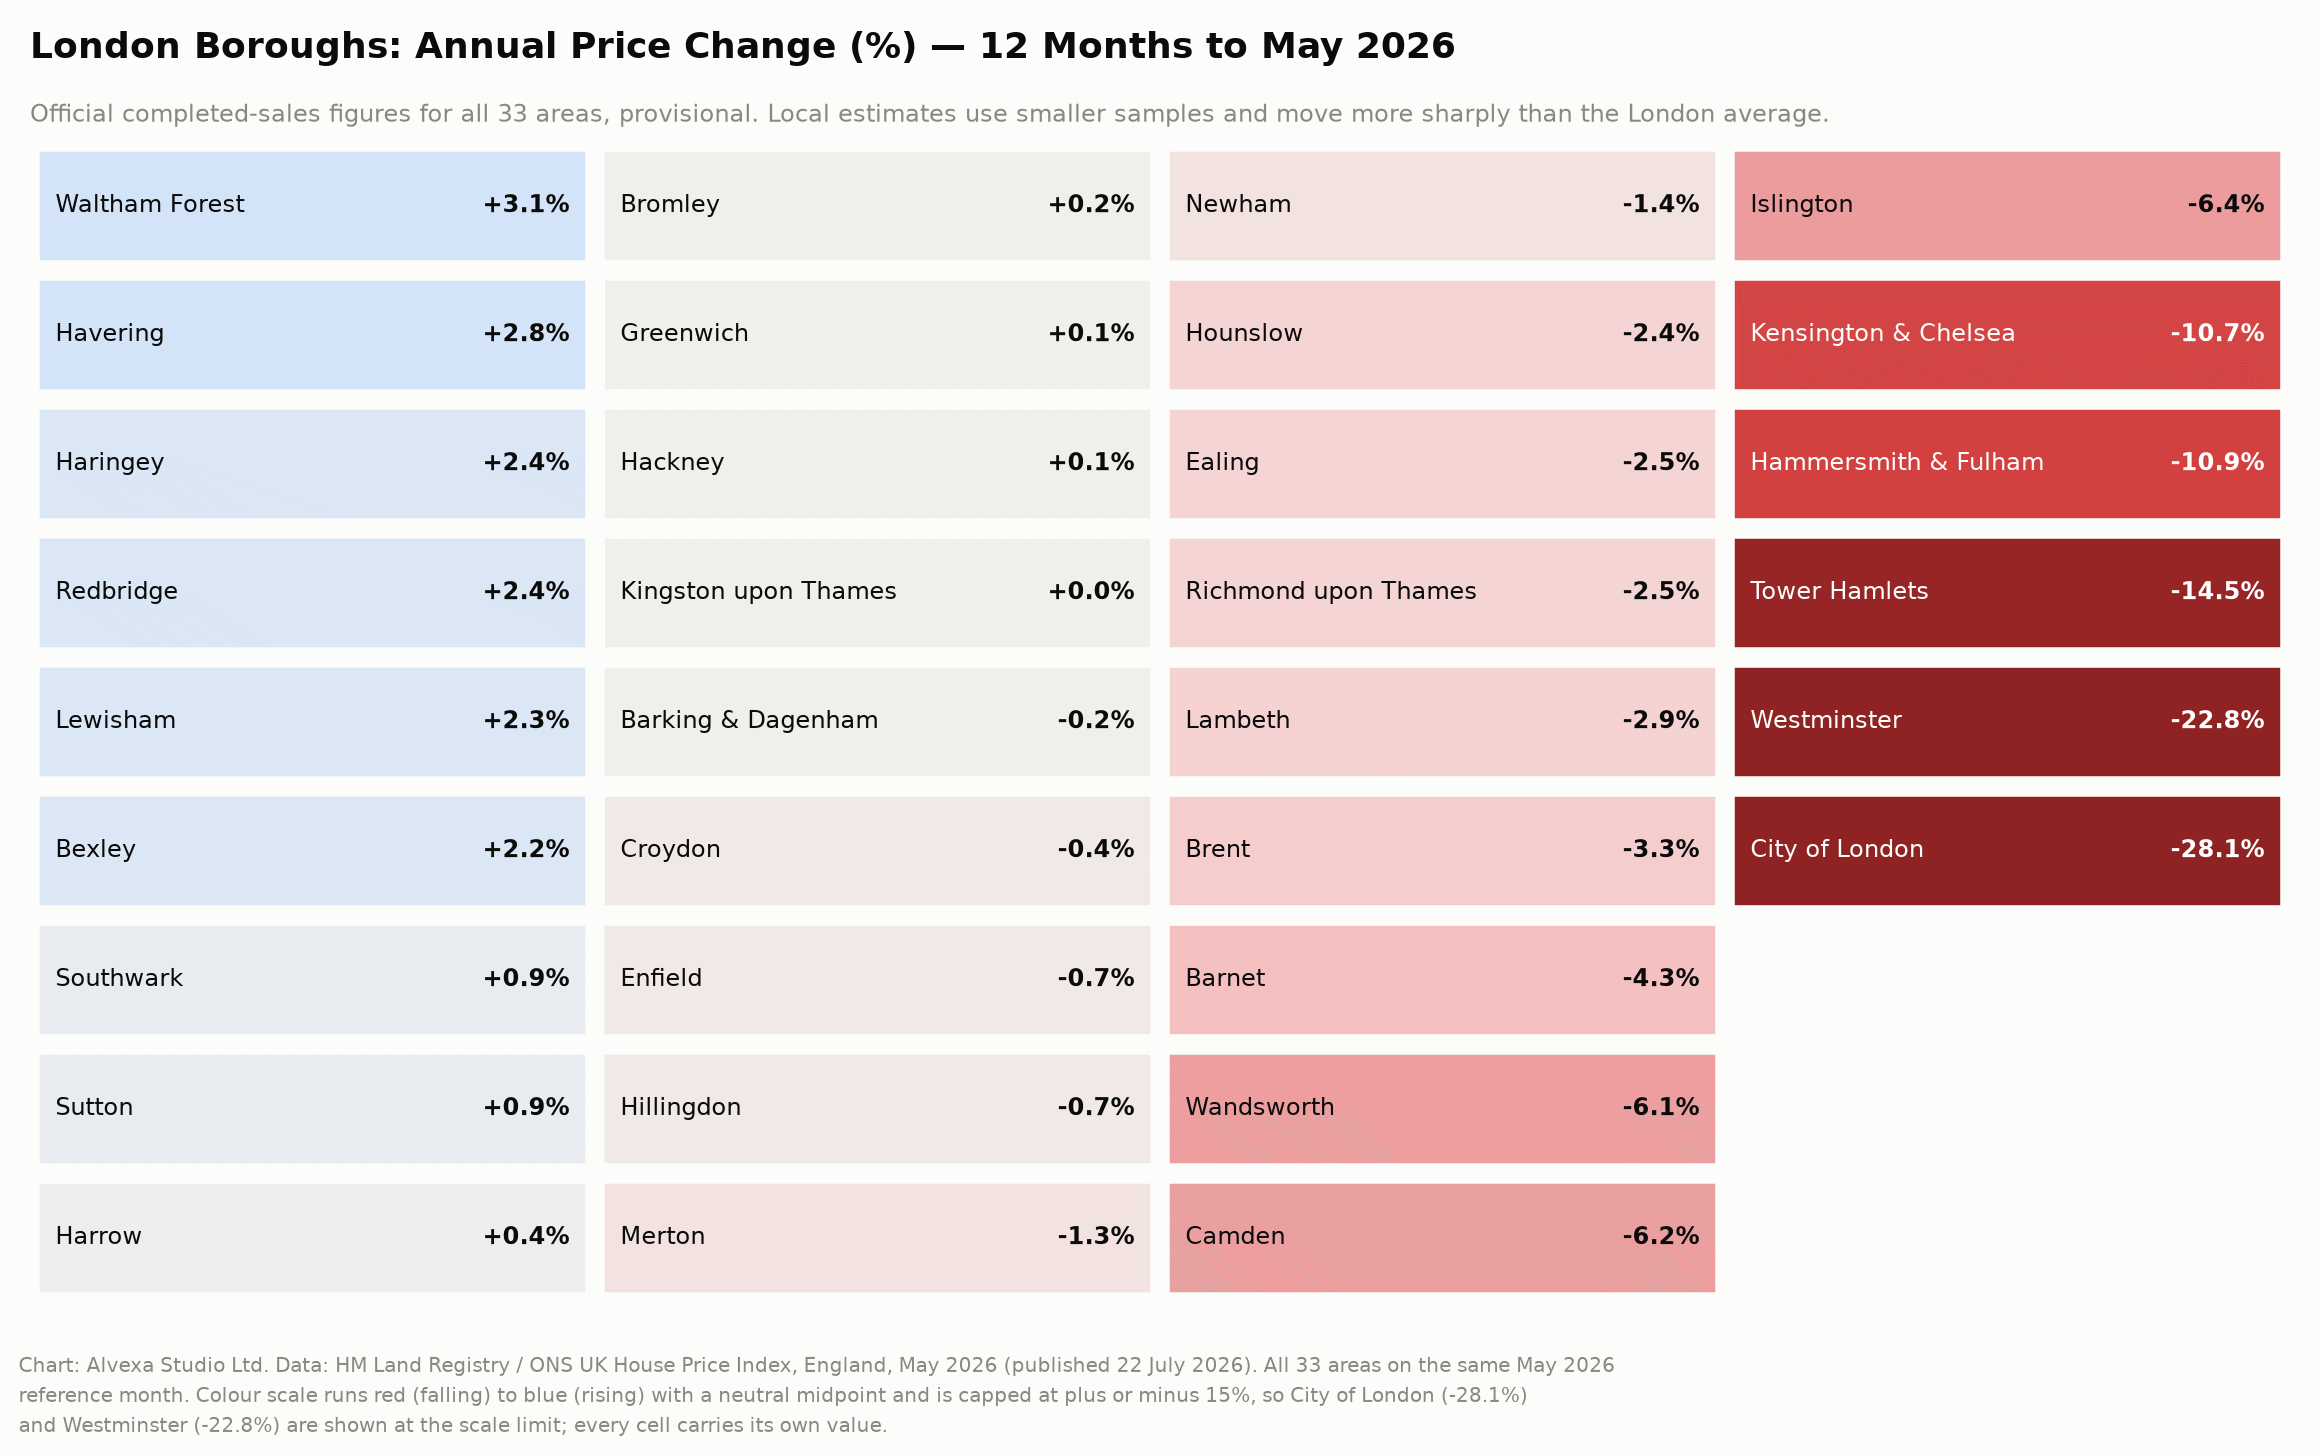
Every borough figure below is a provisional ONS and HM Land Registry estimate for the same reference month, May 2026, published 22 July 2026. ONS cautions that local estimates rest on smaller samples than the London figure and can move more sharply as a result.
Largest Recorded Rises. Waltham Forest recorded the highest annual change of the 33 areas, at +3.1% to £524,000. Havering followed at +2.8% to £453,000; Haringey and Redbridge were both +2.4%, at £634,000 and £496,000 respectively. Lewisham was +2.3% to £497,000 and Bexley +2.2% to £409,000. ONS cautions that these local estimates use smaller samples than the London figure and may be revised.
Largest Recorded Falls. The largest falls were concentrated in higher-value central areas. City of London was 28.1% lower at £627,000; ONS flags this estimate as particularly sensitive to the number and type of properties recorded. Westminster was 22.8% lower at £836,000, Tower Hamlets 14.5% lower at £444,000, Hammersmith and Fulham 10.9% lower at £729,000 and Kensington and Chelsea 10.7% lower at £1,256,000. Islington, Camden and Wandsworth each fell by just over 6%. All are provisional local estimates based on smaller samples than the London figure.
Lower-Priced Boroughs. Barking and Dagenham had the lowest average price at £361,000, 0.2% below a year earlier, followed by Croydon at £397,000 (−0.4%), Newham at £405,000 (−1.4%) and Bexley at £409,000 (+2.2%). Seven areas were within half a percentage point of flat. These are borough-wide provisional averages, not prices for particular properties.
Market Trends & Observations
Discounting in prime London. LonRes reported an average discount to asking price of 10.4% in prime London in June 2026, with 50.5% of completed sales having had a prior reduction and reductions at a record level for the month. Nick Gregori of LonRes said: “Compared to longer-term trends there is less balance in the current market, with more supply than demand and much of that supply subject to price reductions.”
Prime London measures disagree. LonRes put achieved prime London prices 8.2% below a year earlier in June 2026, with transactions up 4.8%. Knight Frank recorded prime central London prices 3.6% lower over the year to June and transactions down 14%. The organisations use different market coverage and definitions, so the figures are reported separately.
Long exchange periods in Propertymark’s survey. Propertymark’s April 2026 data recorded 43.5% of its member agents reporting 17 weeks or more between offer acceptance and exchange — the highest proportion since it began collecting the measure in 2015.
Rates & Policy Watch
The Bank of England held Bank Rate at 3.75% on 30 July 2026, a fifth consecutive hold, on a 6–3 vote; the three dissenters preferred 4%. CPI inflation was 2.6% in June and the July Monetary Policy Report projects a peak near 3.2% in the fourth quarter. Moneyfacts reported average two- and five-year fixed mortgage rates of 5.57% and 5.60% on 22 July. The Renters’ Rights Act changes took effect on 1 May 2026. Making Tax Digital for Income Tax began on 6 April 2026 for those within its scope, with the first quarterly submission due 7 August.
Price Band Analysis
Entry, under £500,000. Twelve of the 33 areas had averages below £500,000 in May 2026. Half the areas recording an annual rise sit here — Bexley, Greenwich, Havering, Lewisham, Redbridge and Sutton — as do the smallest falls, Barking and Dagenham at −0.2% and Croydon at −0.4%. Tower Hamlets is the outlier, at £444,000 and 14.5% lower.
Mid, £500,000 to £1m. Twenty areas sit in this band, and its internal spread is the widest of the three: Waltham Forest at +3.1% and City of London at −28.1% are both in it. Areas at the upper end — Camden, Westminster and Hammersmith and Fulham — moved with the prime pattern rather than the outer-London one.
Prime, £1m and above. Kensington and Chelsea is the only area with an ONS average above £1m, at £1,256,000 and 10.7% lower on the year. The LonRes and Knight Frank prime measures cited above were both negative annually, using their own market coverage. House of Commons Library analysis records London as 67% of England’s £2m-plus sales from January 2024 to April 2026.
Looking Ahead
Published commentary gives different descriptions of the autumn context. LonRes reported more supply than demand and substantial discounting in prime London. Knight Frank’s Stuart Bailey said on 6 July that buyers and sellers “have become more immune to the political noise and posturing, and are getting on with life”. Zoopla reported that housing activity has typically increased in September. These are attributed observations; future market outcomes remain uncertain.
Data Sources & Methodology
Three price measures appear here and are never combined: Rightmove asking prices are what sellers advertise at listing; Zoopla estimates the value of the housing stock; ONS and HM Land Registry record completions, lagging about two months. All 33 borough figures are provisional ONS and HM Land Registry estimates on a single reference month, May 2026, and rest on smaller samples than the London figure. Private sales only.
Data reviewed: 31 July 2026
Report compiled: 31 July 2026
Charts and calculations: Alvexa Studio Ltd
Principal sources
- Rightmove, House Price Index — July 2026, published 20 July 2026, data for July 2026. https://www.rightmove.co.uk/news/house-price-index.html
- Zoopla, House Price Index: July 2026, published 30 July 2026, data to June 2026. https://www.zoopla.co.uk/discover/property-news/house-price-index/
- HM Land Registry and Office for National Statistics, UK House Price Index England: May 2026, published 22 July 2026, data for May 2026. All borough figures are taken from this release. https://www.gov.uk/government/statistics/uk-house-price-index-for-may-2026/uk-house-price-index-england-may-2026
- HM Land Registry, UK House Price Index summary: May 2026, published 22 July 2026. https://www.gov.uk/government/statistics/uk-house-price-index-for-may-2026/uk-house-price-index-summary-may-2026
- Bank of England, Monetary Policy Summary and minutes — July 2026 and Monetary Policy Report — July 2026, published 30 July 2026. https://www.bankofengland.co.uk/monetary-policy-summary-and-minutes/2026/july-2026
- Moneyfacts, Weekly Mortgage Roundup, updated 22 July 2026, average residential fixed mortgage rates on that date. https://moneyfactscompare.co.uk/news/mortgages/best-uk-residential-mortgage-rates-this-week/
- LonRes, Prime London Market Dashboard — June 2026, July 2026 edition. https://lonres.com/public/prime-london-monthly-dashboard-july/
- Knight Frank Research, Tom Bill, Prime Market Braces for Another Summer of Speculation, 6 July 2026. https://www.knightfrank.co.uk/research/article/2026/7/prime-market-braces-for-another-summer-of-speculation
- Propertymark, Housing Insight Report: April 2026, April 2026 data. https://www.propertymark.co.uk/static/669f5284-4ed8-437a-934c3699a519f575/Housing-Insight-Report-April-2026.pdf
- Ministry of Housing, Communities and Local Government, Renters’ Rights Act overview for tenants, updated 1 May 2026. https://www.gov.uk/guidance/renters-rights-act-overview-for-tenants
- House of Commons Library, High Value Council Tax Surcharge and homes over £2 million, briefing CBP-10934, published 2 July 2026. https://commonslibrary.parliament.uk/research-briefings/cbp-10934/
- HM Revenue & Customs, Making Tax Digital for Income Tax, mandatory from 6 April 2026. https://www.gov.uk/guidance/using-making-tax-digital-for-income-tax
Contains public sector information licensed under the Open Government Licence v3.0.
Contains HM Land Registry data © Crown copyright and database right 2026. This data is licensed under the Open Government Licence v3.0.
Frequently asked questions
What is the average house price in London in 2026?
Rightmove put the average asking price of a newly listed London home at £676,248 in July 2026, down 1.6% on the month. The official HM Land Registry and ONS figure for completed sales was £545,000 in May 2026, 3.7% below May 2025. Asking prices and completed sale prices are different measures and are not interchangeable.
Are London house prices going up or down?
On official completed-sales figures, London prices fell 3.7% in the 12 months to May 2026 and 1.2% on the month. HM Land Registry records that as the lowest annual change of the English regions; the South East was next at +1.2%.
Which London borough recorded the highest annual house-price change?
On HM Land Registry and ONS figures for the 12 months to May 2026, Waltham Forest recorded the highest annual change of the 33 London areas at +3.1%, to £524,000. Havering followed at +2.8%, then Haringey and Redbridge both at +2.4% and Lewisham at +2.3%. These are provisional estimates and ONS cautions that local figures rest on smaller samples than the London average.
Which London borough has the lowest average house price?
Barking and Dagenham had the lowest average price of the 33 London areas at £361,000 in May 2026, 0.2% below a year earlier, followed by Croydon at £397,000 and Newham at £405,000. These are provisional estimates on smaller samples than the London figure.
How long did it take to find a buyer in London in July 2026?
Rightmove recorded an average of 70 days to find a buyer in London in July 2026, up from 68 days in June. Finding a buyer is not the same as completing: on Propertymark’s April 2026 data, 43.5% of its member agents reported 17 weeks or more between offer acceptance and exchange of contracts.